Beginning a little over sixty years ago, with only a handful of believers and but few laborers, with practically no facilities, and no institutions or organizations of any kind, this cause started on its career. To-day there stands developed a united, organized body of over one hundred thousand believers, supporting 4,346 evangelistic laborers, and contributing annually for evangelistic work over two million dollars; operating 188 colleges, publishing houses, and sanitariums, and 594 primary schools, with total denominational assets of over ten million dollars, and employing 3,918 institutional laborers; selling annually over a million and a half dollars’ worth of denominational publications, issued in sixty-seven languages, in the form of 1,878 books, pamphlets, or tracts, and 126 periodicals,—these are some of the results for which every believer in this cause has reason to be profoundly grateful. The progress made during 1910, as well as a review of the work of former years, is exhibited in the following pages.
The report this year is presented under three tables, nine summaries, and four diagrams; the tables are arranged as follows: Table No. 1 gives the information regarding the conferences and missions throughout the world, as well as the Sabbath-school, Educational, and Missionary Volunteer departments; Table No. 2 gives the information with references to colleges, publishing houses, and sanitariums, and Table No. 3 presents a summary of the reports from the date of organization of the General Conference in 1863, to the present time, thus making possible annual comparisons.
Value of Churches and Primary Schools; Total Contributions; Communicants.—Summary No. 1
[Table: Value of Churches and Primary Schools; Total Contributions; Communicants.—Summary No. 1. Columns: Union; Value of Church Buildings and Primary Schools; Per Cent of Group; Per Cent of Grand Total; Valuation per Capita; Contributions—All Sources; Per Cent of Group; Per Cent of Grand Total; Total Contributions per Capita; Sabbath-keepers; Per Cent of Group; Per Cent of Grand Total. The table gives the listed union, national, European, and miscellaneous-field totals, including Grand Totals for 1910 and 1909, Net Gain for 1910, and Per Cent of Gain for 1910.]
Summary No. 1
Summary No. 1 presents, in column 2, by unions, the total value of church buildings and primary or church schools, now amounting to $1,896,791.97. Of this amount, $1,721,178.85 (90.74 per cent) is the valuation of the 1,256 church buildings (whose increase in valuation during 1910 was 1.72 per cent), while the remainder, $175,613.12 (9.26 per cent), is the valuation of the buildings and equipment of the 594 church schools (whose increase in valuation during the year was 21.68 per cent). The net gain in value for both churches and schools was $60,514, or 3.30 per cent. In column 3 is indicated the percentage of each union total as related to the total of each group of unions, while the next column gives the percentage which each union total forms of the grand total. The per capita valuation is shown in column 5, the highest valuation being that for the Pacific Union, $32.62, the average for the world being $18.15.
In column 6 is stated the amount of all funds raised in each union. This includes tithes and offerings for all purposes, amounting to $2,223,767.52. The next two columns show, respectively, the percentage of each union total as related to the total for the group and to the grand total. The total contributions per capita are stated in column 9, by which it may be seen that the South African Union takes the lead, by contributing during the year $35.36 per capita. The average for the entire field is $21.27 per capita, a gain of $4.61 per capita during the year. The gain in funds during 1910 was $239,210.37, or 12.05 per cent. In column 10 is given the number of Sabbath-keepers in each union, with the percentages of the group and of the grand total shown in columns 11 and 12. Thus it is shown that the largest number of Sabbath-keepers is in the Lake Union, constituting 18.18 per cent of the number in the United States, or 11.11 per cent of the grand total. In the United States there are 61.14 per cent of the grand total; in Canada, 2.28 per cent; Australasia, 4.40 per cent; Europe, 21.00 per cent; other fields, 11.18 per cent. The net gain in Sabbath-keepers in the entire field during 1910 was 3,595, or 3.56 per cent. A comparison of columns 4, 8, and 12 indicates the respective relation as to the value of churches, contributions, and communicants in each union and group. Note that in the United States these percentages are, respectively, 83.96, 72.87, and 61.14.14
Summary No. 2
In Summary No. 2 is stated, in column 2, the percentage which the population of each union conference sustains to the grand total population of all countries where work is being conducted by the denomination. In column 3 is shown the number of inhabitants in each union for each Seventh-day Adventist in that union. Note, for instance, that in the United States for each Seventh-day Adventist there are 1,439 persons; while outside the United States for each Seventh-day Adventist there are 32,810 persons; that is, if the population were divided into congregations, for each Seventh-day Adventist in the United States there would be a congregation numbering 1,439, while for those living outside the United States the congregation would number twenty-three times as large, or 32,810 persons (some countries numbering very much higher, as in India, 531,197). The ratio, then, between the communicants in the United States and those outside this country in relation to the population of each respective territory, is as 1 to 23. An equal distribution of communicants throughout the world according to population would assign to the United States only 2,779 Seventh-day Adventists.
The total laborers in the United States, 2,252, related to the population of the United States would give each a congregation of 40,868, while each of the 2,094 laborers outside the United States would have a congregation more than fifteen times as large, or 626,288 persons. The ratio, then, between the workers in the United States and those outside the United States in respect to population of each respective territory, is as 1 to 15. An equal distribution of the laborers throughout the world according to population, would assign to the United States only 288 laborers.
Column 4 gives the total number of evangelistic laborers by unions, while column 5 states the number of Seventh-day Adventists for each evangelistic worker in the respective union. This summary readily indicates such portions of the field as are poorly supplied with laborers, and something as to the relation of laborers to the communicants.
Summaries Nos. 3 to 7 are the result of much painstaking research, requiring the examination of thousands of pages of periodicals, year books, documents, and all other available means for securing the information desired. It is not claimed that the results are perfect; in fact, it is impossible to secure complete returns, for the reason that during the earlier years of this cause few statistical records or reports were filed or printed; and while much historical data may be found, and many historical sketches presented from time to time, yet the information is in many instances too indefinite, statistically, to do much more than use it as a basis for forming estimates. For the earlier years in all these summaries, therefore, the information given is in some instances estimated. To illustrate, while the assets of an institution could be secured for a certain year, for another year it would be impossible to obtain any data, but the next year the thread could be taken up again; for the intervening year it was necessary, therefore, to estimate. But it may safely be considered that for all practical purposes the information contained in these summaries is substantially correct. With the records available (and they are practically everything that has ever appeared), the results stated are perhaps the best that could be presented. Some of the foot-notes in connection with summaries direct attention to certain discrepancies in earlier years.
The desirability of securing this information has been recognized for a number of years. As the reader looks down the expanding columns of figures representing the growth that has come to the various departments of this cause, he can but the more forcibly realize that the providence of God has worked marvelous changes. This success has been realized in various departments of work, and in many countries of the world. Truly one is led to exclaim, “What hath God wrought!”
The summaries above referred to will now be taken up in detail, thus showing the growth of each department.
Population, Percentages, and Ratios.—Summary No. 2
[Table: Population, Percentages, and Ratios.—Summary No. 2. The table lists each union and field with its percentage of grand total population, inhabitants per Seventh-day Adventist, evangelistic workers, and inhabitants per evangelistic worker. Grand Totals for 1910: population percentage 100.00, 13,627 inhabitants per communicant, 4,346 evangelistic workers, and 24 inhabitants per worker. Additional laborers in institutions: 3,918. Grand Total Laborers: 8,264.]
Publishing Department.—Summary No. 3
[Table: Publishing Department.—Summary No. 3. Years 1850–1910, showing publishing houses, assets, book and periodical sales, employees, periodicals, and languages.]15
Summary No. 3
This is a summary of the Publishing Department. It was in July, 1849, at Middletown, Conn., that the first periodical literature appeared in behalf of this cause. This was the paper entitled Present Truth, the name of which was in 1850 changed to Second Advent Review and Sabbath Herald, which, with slight change of name, is continued at the present time. With this small beginning the work gradually grew until at the present time there are twenty-eight publishing houses, with assets of $1,176,092.39; a net gain in assets during the year, of $33,967.77, or 2.98 per cent. The summary shows that the book and periodical sales for 1910 were $1,560,510.58, a gain of $158,066.58 for the year, or 11.24 per cent. The total employees connected with the publishing houses now number 610. Publications of all kinds are now issued in sixty-seven languages in the form of 363 bound books, 315 pamphlets, 1,200 tracts, and 126 periodicals, the total value of one copy of each kind of publication or annual subscription, being $525. The per capita of book and periodical sales for 1910 was $14.93.
Sanitariums.—Summary No. 4
[Table: Sanitariums.—Summary No. 4. Years 1866–1910, showing number of sanitariums, assets, physicians, and total employees.]
Summary No. 4
Summary No. 4 relates to Sanitarium work. It was on the 5th of September, 1866, that the first sanitarium operated by this denomination was formally opened for the reception of patients. This was the Battle Creek Sanitarium, which for many years continued to be the only institution among us. Gradually the number of institutions and their assets increased, as indicated in the summary. The physicians, nurses, and other employees have also increased in like manner. The assets of the seventy-four institutions now amount to $3,368,041.46, a net gain for the year 1910 of $106,860.32, or 3.28 per cent, while the gain in employees has been 155, or 8.45 per cent.
Educational Department.—Summary No. 5
[Table: Educational Department.—Summary No. 5. Years 1872–1910, showing primary schools, teachers, enrolment, value, annual maintenance, colleges and intermediate schools, teachers, enrolment, and value.]
Summary No. 5
This summary gives information regarding the educational work. The first denominational school was opened in Battle Creek, Mich., June 3, 1872, under the supervision of the General Conference Committee, with Prof. G. H. Bell in charge. This school developed into Battle Creek College, which was incorporated March 11, 1874. The summary also indicates that the first primary or church-school was opened in 1880. This was a school conducted in Oakland, Cal. The establishment of such schools, however, was not very general until about fifteen years later. The number of schools conducting work in the primary grades and those conducting work in advanced grades, with the number of teachers, and students enrolled, and the valuation of each class of school, are clearly indicated in the summary. From this it is shown that there are now a total of 680 denominational schools; 1,319 teachers, 42.46 per cent of whom are teaching in schools of advanced grades; 20,526 students enrolled, 34.93 per cent of whom are in schools of advanced grades. The total valuation of these schools is $2,115,806.27, 91.69 per cent of which is the valuation of the eighty-six advanced schools. The net increase in valuation of all schools for the year is $272,412.18, or 11.48 per cent. The enrolment constitutes 19.64 per cent of the total communicants.
The above recapitulation gives the total investment by the denomination in institutions, church buildings, conferences, etc., now amounting to over ten and a half million dollars, or a per capita of $101.73. A few interesting comparisons may be noted, as follows: The assets of the publishing houses constitute 11.06 per cent of the total investment, while the employees form 7.38 per cent of the total laborers. The investment in sanitariums is 31.67 per cent of the total investment, and such employees are 24.06 per cent of the total. The investment in educational work is 19.90 per cent, the employees forming 15.97 per cent. The investment in churches, conferences, tract societies, etc., is 37.37 per cent (as against 62.63 per cent invested in institutions), while the workers engaged in these lines form 52.59 per cent of the total laborers (as against 47.41 per cent of laborers in institutions). Institutions having an investment of 62.63 per cent of total assets, are operated by 47.41 per cent of total laborers; while conferences, etc., having 37.37 per cent of total assets are employing 52.59 per cent of total laborers engaged in service.
Institutional Recapitulation
[Table: Institutional Recapitulation. Publishing houses: 28 institutions, $1,176,092.39, 11.06 per cent, 610 employees, 7.38 per cent. Sanitariums: 74, $3,368,041.46, 31.67 per cent, 1,989 employees, 24.06 per cent. Colleges, etc.: 86, $1,940,193.15, 18.25 per cent, 561 employees, 6.78 per cent. Primary schools: 594, $175,613.12, 1.65 per cent, 758 employees, 9.19 per cent. Totals: 782, $6,659,940.12, 62.63 per cent, 3,918 employees, 47.41 per cent. Evangelistic summary: church buildings, 1,256, $1,721,178.85, 16.19 per cent; conferences, associations, tract societies, etc., $2,252,147.74, 21.18 per cent, 4,346 employees, 52.59 per cent. Grand totals: 2,038, $10,633,266.71, 100.00 per cent, 8,264 employees, 100.00 per cent. Per capita, $101.73.]16
Summary No. 6
Summary No. 6 pertains to the Sabbath-school Department. The year 1878 is selected as the starting point, for the reason that it was on March 4 of that year, during the third special session of the General Conference, that the General Sabbath-school department was organized. Sabbath-schools had been conducted for years prior to that time. The summary indicates, in columns 2 and 3, the number of schools and their membership. In column 4 is indicated the percentage which the Sabbath-school membership sustains to the church membership. The total contributions are listed in column 5, with the amount per capita for the various years in column 6. Donations to missions are shown in column 7, while in column 8 is indicated the percentage of total contributions which has been devoted to mission purposes for the various years. The average for all the years since 1886 (at which time a portion of the Sabbath-school funds were first devoted to mission purposes, so far as any records are obtainable) is 71.04 per cent. That is, during all these years, 71.04 per cent of the total contributions received has been passed on by the local Sabbath-schools to foreign missions. During the last three years the percentage has steadily mounted upward, so that for the year 1910 the amount devoted to mission purposes constituted 97.67 per cent of the total contributions. At the same time the amount given per capita has steadily increased, and to-day it is the highest in the history of our Sabbath-school work, now amounting annually to $1.36 per member throughout the world. This amount is more than ten times greater than was the per capita when Sabbath-school contributions were first received. The Sabbath-school contributions now constitute 6.20 per cent of total contributions from all sources, and being devoted almost entirely to foreign missions, form a considerable part of funds for such work. The net gain in total contributions for the year amounts to $17,354.92, or 4.35 per cent. The net increase in donations to missions for the year has been $20,616, or 18.04 per cent.
Sabbath-School Department.—Summary No. 6
[Table: Sabbath-School Department.—Summary No. 6. Years 1878–1910, showing schools, membership, percentage of communicants, total contributions, per capita, donations to missions, and percentage devoted to missions. Totals: total contributions, $1,312,452.77; donations to missions, $932,379.28; percentage, 71.04. e Estimated.]
Prior to 1900 the percentages in this column are based on church members; from 1900 to 1910, based on Sabbath-keepers. For most of the years from 1887 to about 1900, three or four conflicting reports from original sources may be found. For instance, the official reports in the Sabbath School Worker, the General Conference Bulletin, and the Year Book seldom agree in any particular; and every few years a summary appeared, in which other conflicting figures were noted. No responsibility is assumed for the figures between the dates mentioned, the compiler of this table not attempting to decide between the merits of each set of conflicting reports, but rather choosing those which have been published in summaries most frequently in later years, which in most cases were the highest amounts reported.
Missionary Volunteer Department.—Summary No. 7
[Table: Missionary Volunteer Department.—Summary No. 7. Years 1902–1910, showing societies, members, percentage of communicants, contributions for foreign work, home missions, local work, total contributions, per capita, and percentage to foreign work. Totals: foreign work, $42,692.79; home missions, $19,345.22; local work, $8,555.14; total contributions, $70,593.15; percentage to foreign work, 60.47. b Funds from beginning of organization to Dec. 31, 1906. e Estimated.]
Summary No. 7
This summary gives information pertaining to the Missionary Volunteer Department, by which it is shown that there are now 647 societies, with a membership of 12,408, constituting 12.55 per cent of the total Sabbath-keepers. The total contributions for the year amounted to $18,807.03, or $1.51 per capita, 62.60 per cent of which was spent in foreign work. The careful reader who compares this report with the one for 1909 will observe that there has been a decrease reported in the membership of the conferences in the United States. This decrease is apparent only, and comes from the adoption of the per capita basis of raising funds. Although this plan has been in operation for some time, yet its results have seemed to reach the churches themselves in a way to affect the returns for 1910. In cases where no reports have been received for 1910, it has been necessary to estimate, and such fact has been noted in the tables. It seems almost impossible to secure returns from every official, despite the earnest endeavor put forth to secure reports from every field. The most difficult feature in the preparation of these reports is attempting, repeatedly, to induce careless, indifferent officials to do their duty in reporting the information called for; and this difficulty is increasing as the work grows.17
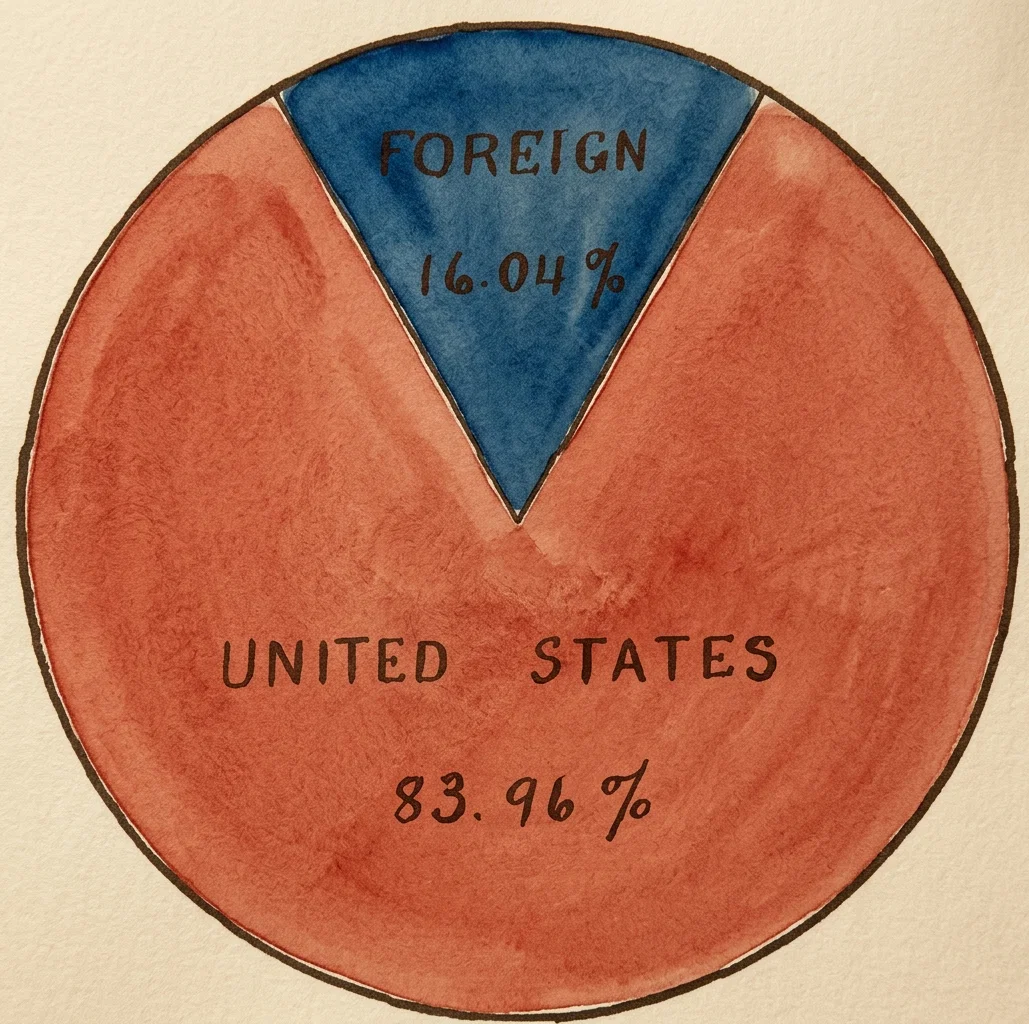
The preceding diagram shows that of the total valuation of church buildings and primary schools, there is in the United States 83.96 per cent, and in other countries, 16.04 per cent.
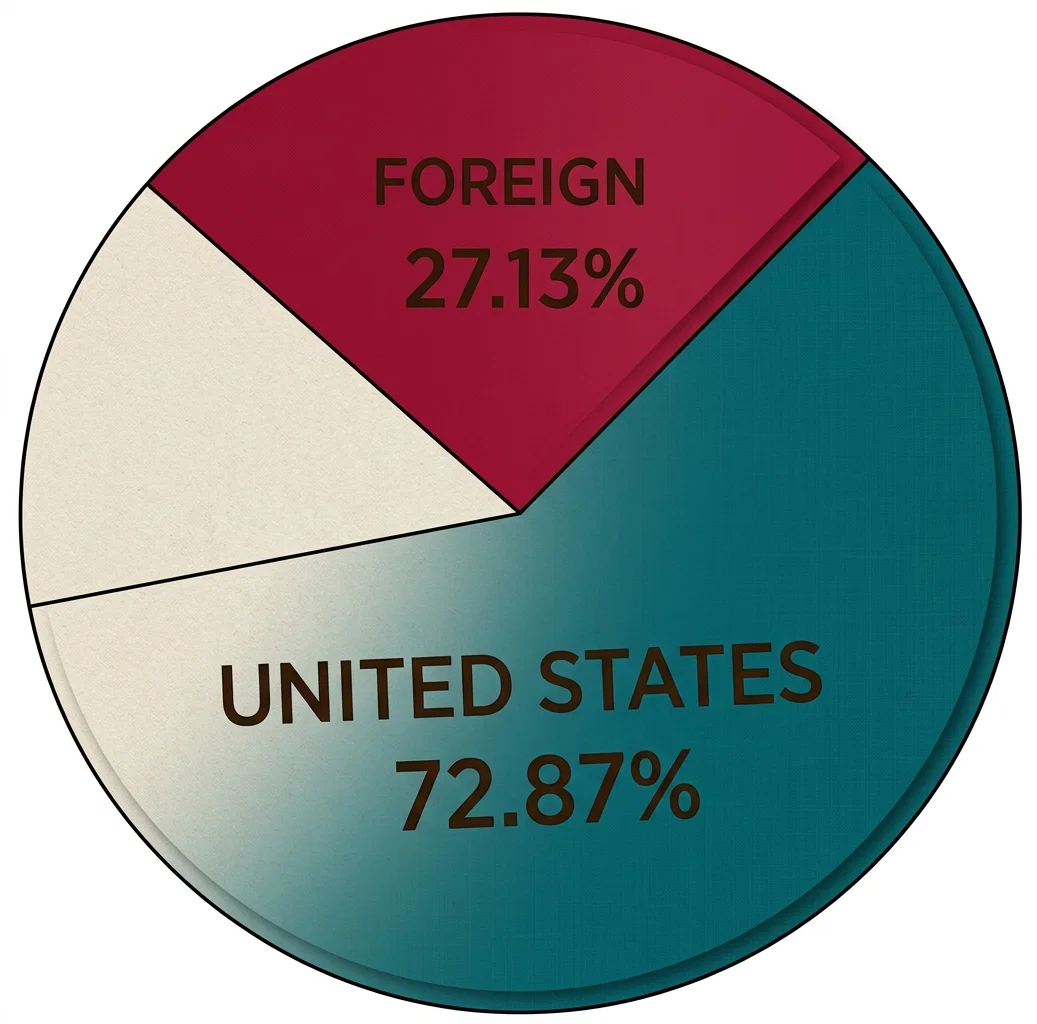
The above diagram indicates that of the total contributions from all sources, there was raised in the United States 72.87 per cent, and in all other fields 27.13 per cent.
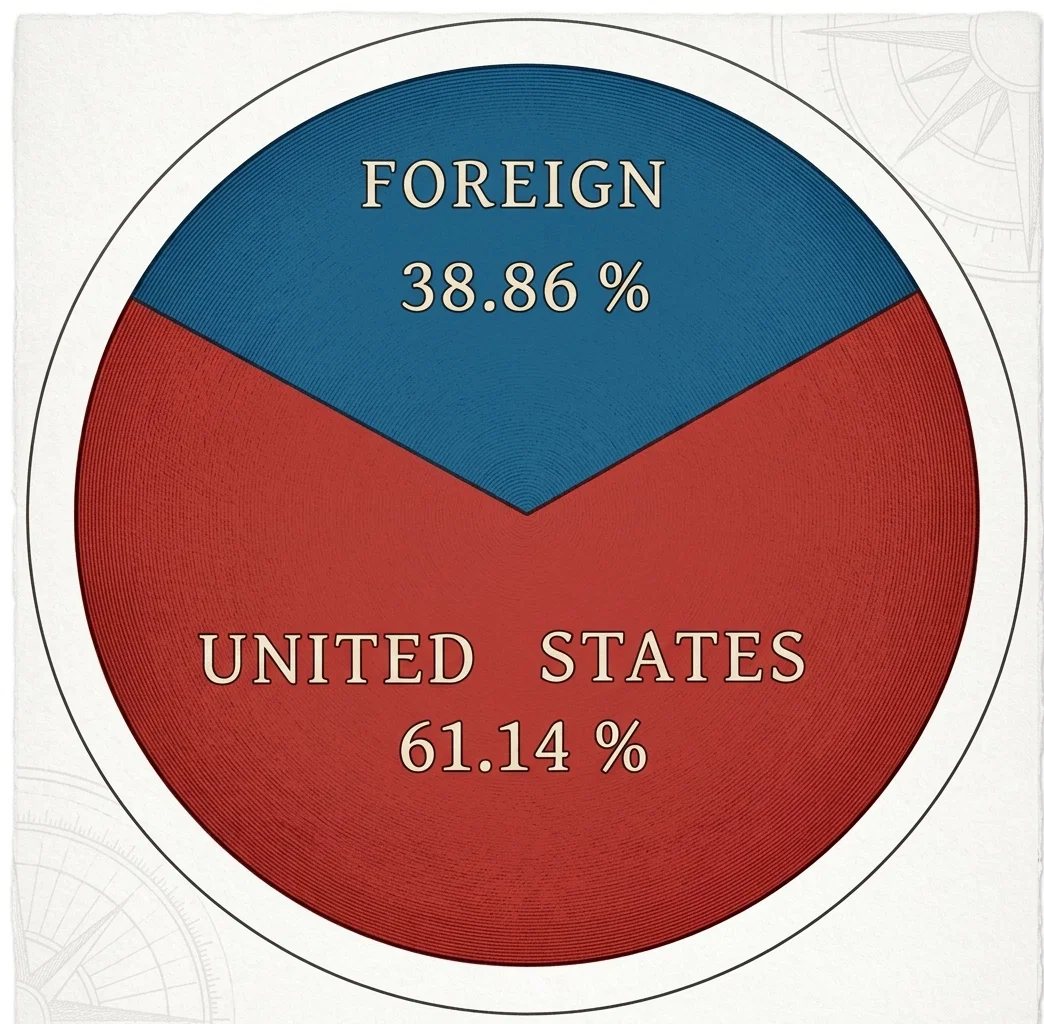
The foregoing diagram illustrates the relation of communicants in the United States and in other fields, showing that in the former there is 61.14 per cent, and in all other countries 38.86 per cent.
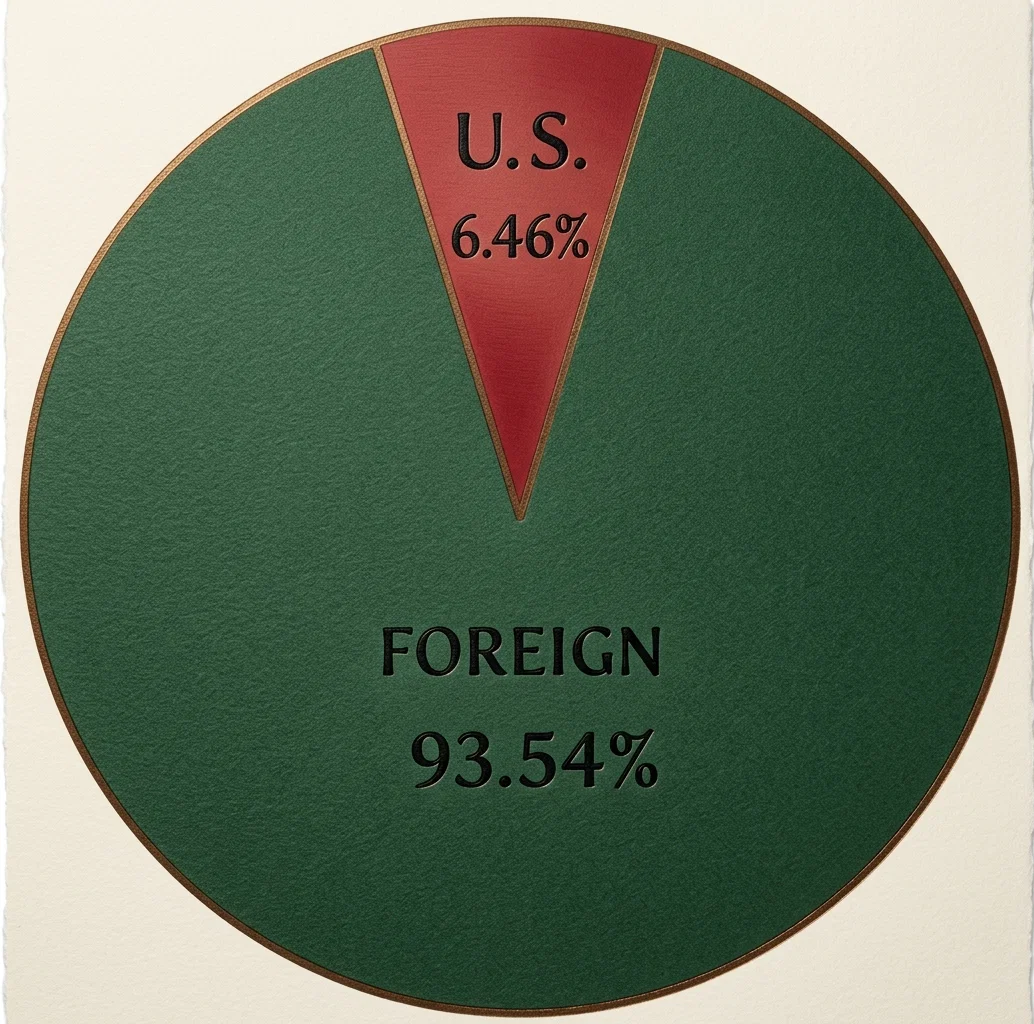
The above diagram indicates that the population of the United States constitutes but 6.46 per cent of the total population where denominational work is being conducted, while the population of all other fields forms 93.54 per cent.
Financial Summary for 1910.—Summary No. 8
[Table: Financial Summary for 1910.—Summary No. 8. Tithe, offerings, special funds, home missions, local church work, and grand totals. Grand total for 1910: $2,223,767.52; total for 1909: $1,984,557.15; net gain: $239,210.37; per cent of gain: 12.05%; per capita for the world: $21.27.]18
Statistical Report of Seventh-day Adventist Conferences and Missions
Church and Conference Work
[Table: Church and Conference Work—Table No. 1, listing conferences and missions with population, churches, membership, Sabbath-keepers, tithe receipts, church buildings, estimated value, seating capacity, ministers, missionaries, laborers, and book and periodical sales.]19
For the Year Ending Dec. 31, 1910—Table No. 1
[Continuation of Table No. 1: Sabbath-School Department, Educational Department, and Missionary Volunteer Department.]20
Statistical Report of Seventh-day Adventist Conferences and Missions
Church and Conference Work
[Continuation of Table No. 1, listing Canadian, Australasian, British, German, Latin, Levant, Russian, Scandinavian, and East African conferences and missions.]21
For the Year Ending Dec. 31, 1910—Table No. 1 (Cont’d)
[Continuation of Table No. 1: Sabbath-school, educational, and Missionary Volunteer returns.]22
Statistical Report of Seventh-day Adventist Conferences and Missions
Recapitulation
[Recapitulation of Table No. 1. Totals for 1910 include 104,526 Sabbath-keepers, 4,346 total laborers, and $1,338,689.65 in tithes.]
Remarks regarding the rapid development of the work, and comments upon various features of this report, might be made at considerable length; but it is unnecessary; the figures speak for themselves, and make plain the whole story. It will be sufficient, in closing, to allude briefly to a few of the leading facts, which are clearly set forth in Summary No. 9. This shows that during the last forty-five years there has been a gain of 99 conferences (and, in addition, there are now 87 mission fields where in 1865 there was none). There are now 188 institutions, instead of but one in 1865. The valuation of institutions, etc., has increased over ten million dollars, and the gain in communicants has been over 100,000. The total annual contributions has increased over two million dollars, while the amount contributed annually has increased from $3.00 per capita to $21.27 per capita. That is, to-day there are twenty-five times the number of communicants that there was in 1865, when the cause had been gathering believers for about twenty years; and each one of that increased number is giving over seven times the amount of contributions for the spread of the special message represented. This latter amount is the most encouraging item in the entire report, indicating as it does the devotion and loyalty in the hearts of this people to the cause they love. This fact speaks volumes regarding future progress, and should give each believer a determination to do even more to extend the message to fields unentered.
That which inspires confidence in the ultimate success of a movement is the demonstrated evidence of its growth and development. What greater evidence could one expect than is seen in this cause? Within a single generation its numbers multiplied by twenty-five, and each member contributing for the support of the work over seven times the amount contributed per member a generation ago. Thus the efficiency of each member has increased sevenfold, and the numbers multiplied by twenty-five; in other words, over 175 times more work is being accomplished to-day for the support and extension of this cause than was being done a generation ago; and this relates only to the evangelistic phase, and takes no account of the institutional work now being carried forward as a strong auxiliary factor in the promulgation of this cause. And the end is not yet; for the Lord has set his hand to finish his work in the earth, and in so far as these means and agencies are consecrated to this purpose, he will use them in a wonderful way for the accomplishment of this result.
Foot-Notes for Table No. 1
Denominational Institutions — Table No. 2
Section 1 — Educational Institutions
A. Under Conference Supervision
[Table: Educational institutions under conference supervision, listing names, addresses, assets, buildings, acres, capacity, enrolment, teachers, grades, library volumes, laboratory and manual-training facilities, graduates, and students entering denominational work.]23
Foot-Notes for Table No. 2
Section 1
Section 2—Publishing Houses
[Table: Publishing houses, with name, address, assets, book sales, periodical sales, buildings, employees, periodicals, and languages. Totals for 1910: 28 houses; assets, $1,176,092.39; book sales, $1,016,331.74; periodical sales, $544,198.84; 610 employees; 126 periodicals; 67 languages.]
Section 3—Sanitariums
A. Under Conference Supervision
[Table: Sanitariums under conference supervision, with name, address, assets, buildings, acres, capacity, patients treated, charity work, physicians, nurses, other employees, and total employees.]24
Section 2
The languages in which denominational publications of all kinds were issued at the close of 1910, are the following:—Arabic, Armenian, Armeno-Turkish, Battak, Bengali, Bohemian, Bulgarian, Burmese, Cantonese (China), Chasu (East Africa), Chitonga (South Africa), Croatian, Danish-Norwegian, Dutch, English, Esthonian, Fijian, Finnish, French, German, Greek (Modern), Greco-Turkish, Hawaiian, Hebrew, Hindi, Hungarian, Icelandic, Italian, Japanese, Javanese, Java-Malay, Kafir (Xosa), Korean, Laplandish, Lettonian, Lithuanian, Malay (Singapore), Mandarin (China), Manganja (East Africa), Maori (New Zealand), Marathi, Niue, Polish, Portuguese, Rarotongan, Rumanian, Russian, Samoan, Santalí, Servian, Sesuto (South Africa), Slovakian, Soenda (Roman), Spanish, Swahili, Swedish, Tagalog, Tahitian, Tamil (India), Tongan, Turkish, Urdu (Roman), Urdu (Persian), Welsh, Wendic, Wen-li (China), Yiddish, Zulu. Total languages, 67.
Section 3
[Table: Summary of Statistical Reports, 1863 to 1910—Table No. 3, showing conferences, missions, ministers, licensed missionaries, canvassers, total laborers, churches, membership, Sabbath-keepers, tithe, per capita, offerings to missions, Sabbath-school offerings, and book and periodical sales.]
Foot-Notes for Table No. 3
1. Estimated conservatively.
2. By the term “mission” is meant a local field not yet organized into a conference, whether in the United States or elsewhere.
3. In the column showing total laborers are included all persons specified in preceding columns as well as all other evangelistic laborers not thus specified. The amount shown in this column is therefore frequently more than the total of the four preceding columns.
4. Beginning with 1900, the report shows the number of Sabbath-keepers, as well as the church-membership. The difference is made up of members of companies and isolated believers. From this date the per capita is based on the Sabbath-keepers.
5. From 1886 to 1910 the amount given to missions, and included in the preceding column, was $932,275.48, leaving $380,072.49 expended otherwise.25
Section 3—Sanitariums (Cont’d)
B. Under Private Management
[Table: Sanitariums under private management, with name, address, assets, buildings, acres, capacity, patients treated, charity work, physicians, nurses, other employees, and total employees. Grand totals for all sanitariums for 1910: 74 institutions, assets $3,368,041.46, 260 buildings, 1,809 acres, capacity 2,916, 33,127 patients treated, $74,632.68 charity work, 116 physicians, 1,109 nurses, 764 other employees, and 1,989 total employees.]